Fitting Die Maintenance Into Press Operations
When a die for a production part needs maintenance, finding the least-cost fix in the shortest time is critical. Here are some ways that tooling engineers can achieve time savings of over 80 percent and avoid costly die rework by using next generation root cause software to simulate the iteration process.
Posted: February 11, 2013
For tool maintenance as well as part launches in most shops, the process is sequential and similar:
- Measure and review dimensional data of a few sample parts.
- Agree on data interpretation.
- Make a best estimate of the root cause.
- Identify fix options.
- Make adjustments and re-run the process.
- Repeat steps (1-5) above until the process seems to be in control and capable.
- Manually create charts and graphs to document any results for a buyoff report.
We have found that there is significant potential to improve this process when the engineers in the shop are certain that the process is in control and exactly what the limits of process capability really are. Three factors are critical to determine this:
- Data validation. That is, reconciling the coordinate measuring machine (CMM), scanner, gage and CAD nominal data.
- Isolating the root cause. Identifying whether the process is in control and the limits of its capability.
- Simulation: The ability to simulate changes without having to run additional parts.
ROOT CAUSE SOFTWARE FOR PROCESS ENGINEERING
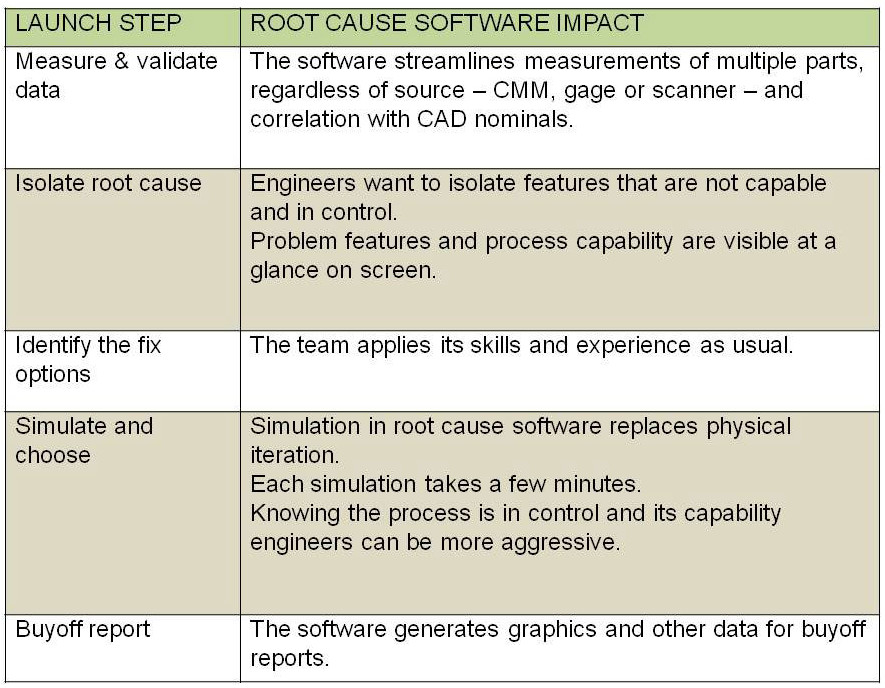
The next generation of root cause software, Launch-Rite, is now available to help the shop engineers reduce the number of steps in tool maintenance and accelerate the process (see Table 1) so that those seven steps are reduced down to four. Graphic displays in this software can convert reams of tabular data into salient details that engineering teams can grasp at a glance.
Simulation within the software replaces most of the iteration of actual parts and assemblies. Much of the manual labor of assembling data for buyoff reports becomes automated through software tools that leverage the skills and experience of the engineers. In sum, tool maintenance can now fit much more easily inside the fast and furious world of operations.
APPLYING THE PRINCIPLES
Let’s look at how these principles can be applied to a typical real-world maintenance situation. Consider, for example, a takeover tool at Pridgeon & Clay, Inc. (Grand Rapids, MI), one of the largest independent value-added manufacturers and suppliers of stamped and fine blanked components for the automotive industry. With additional facilities in Europe and Mexico, their full-time workforce includes over 1,300 employees worldwide.
The Problem
For a takeover part, the OEM requires a sample submittal and process capability of critical features of 1.67. Parts are to be to print and the process must be capable prior to moving to Pridgeon & Clay, but the previous supplier is shutting down and lacks the resources to repair the tool.
The part is already in production. Fortunately, the part is produced by a progressive die in several operations at different stations. This allows a more creative approach than if the parts were produced as a single draw between one cavity and one core.
The first run of parts failed the gage checks. Gage and CMM results also disagree.
Validating Data
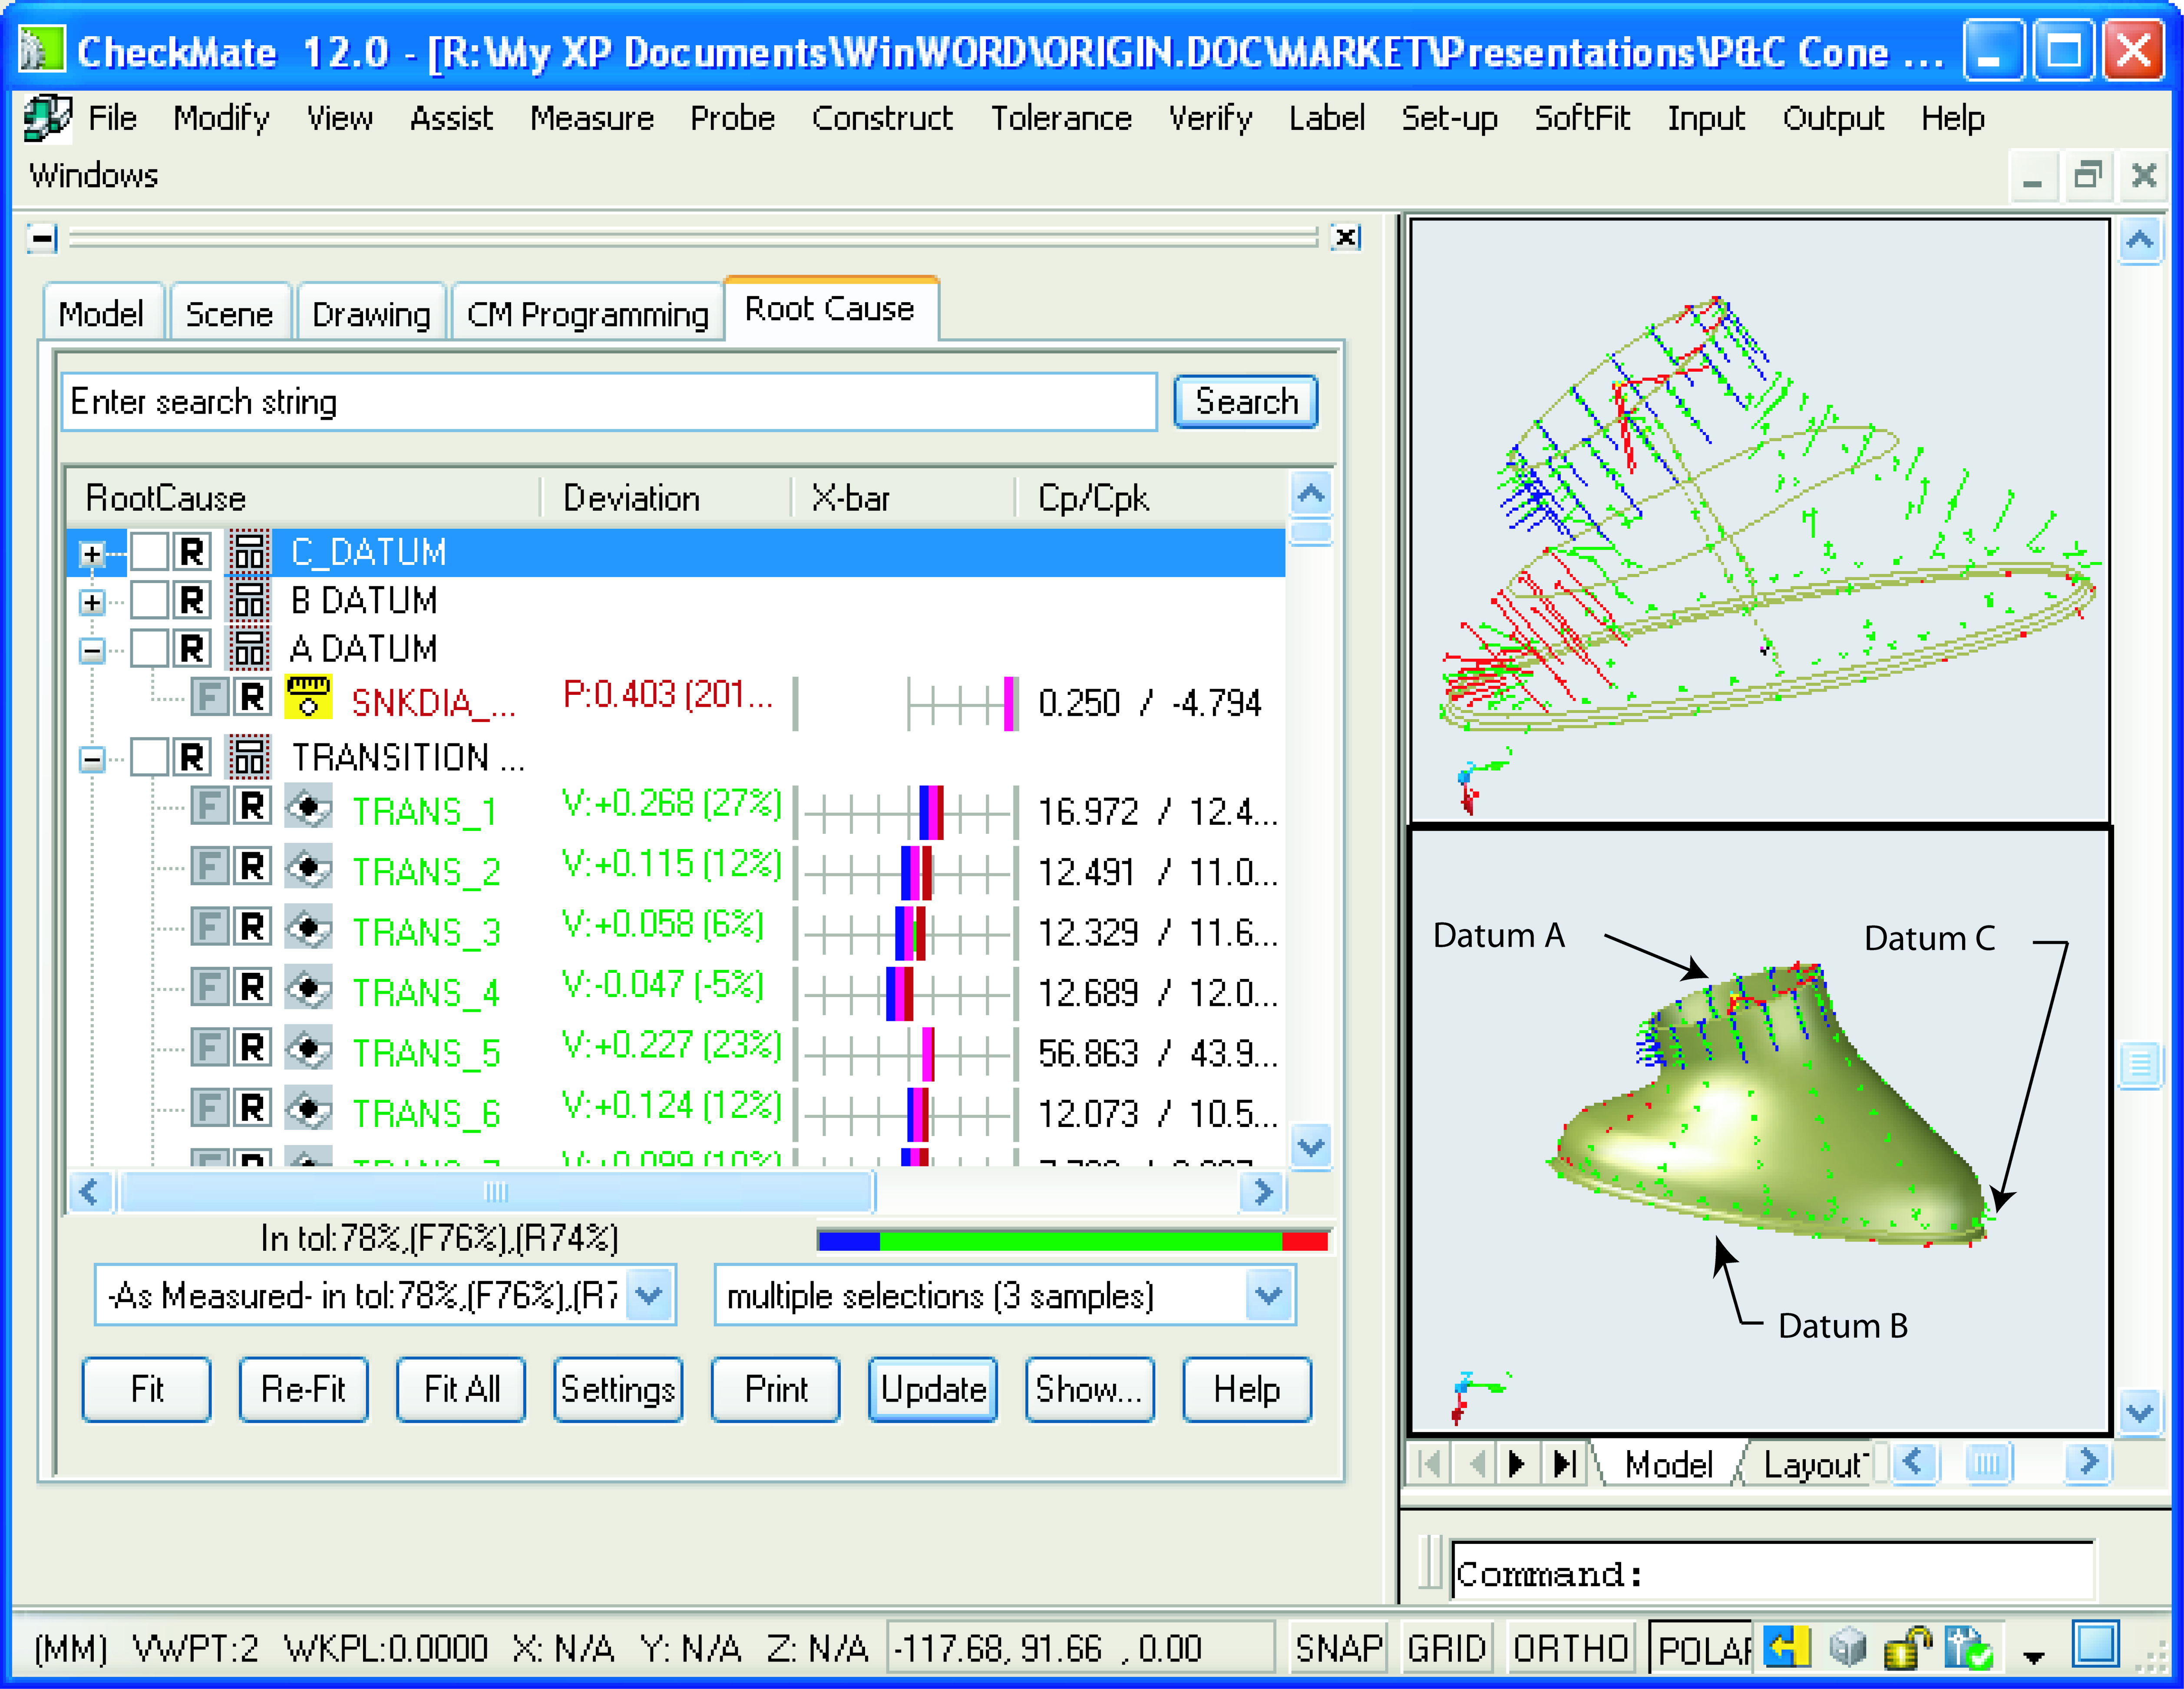
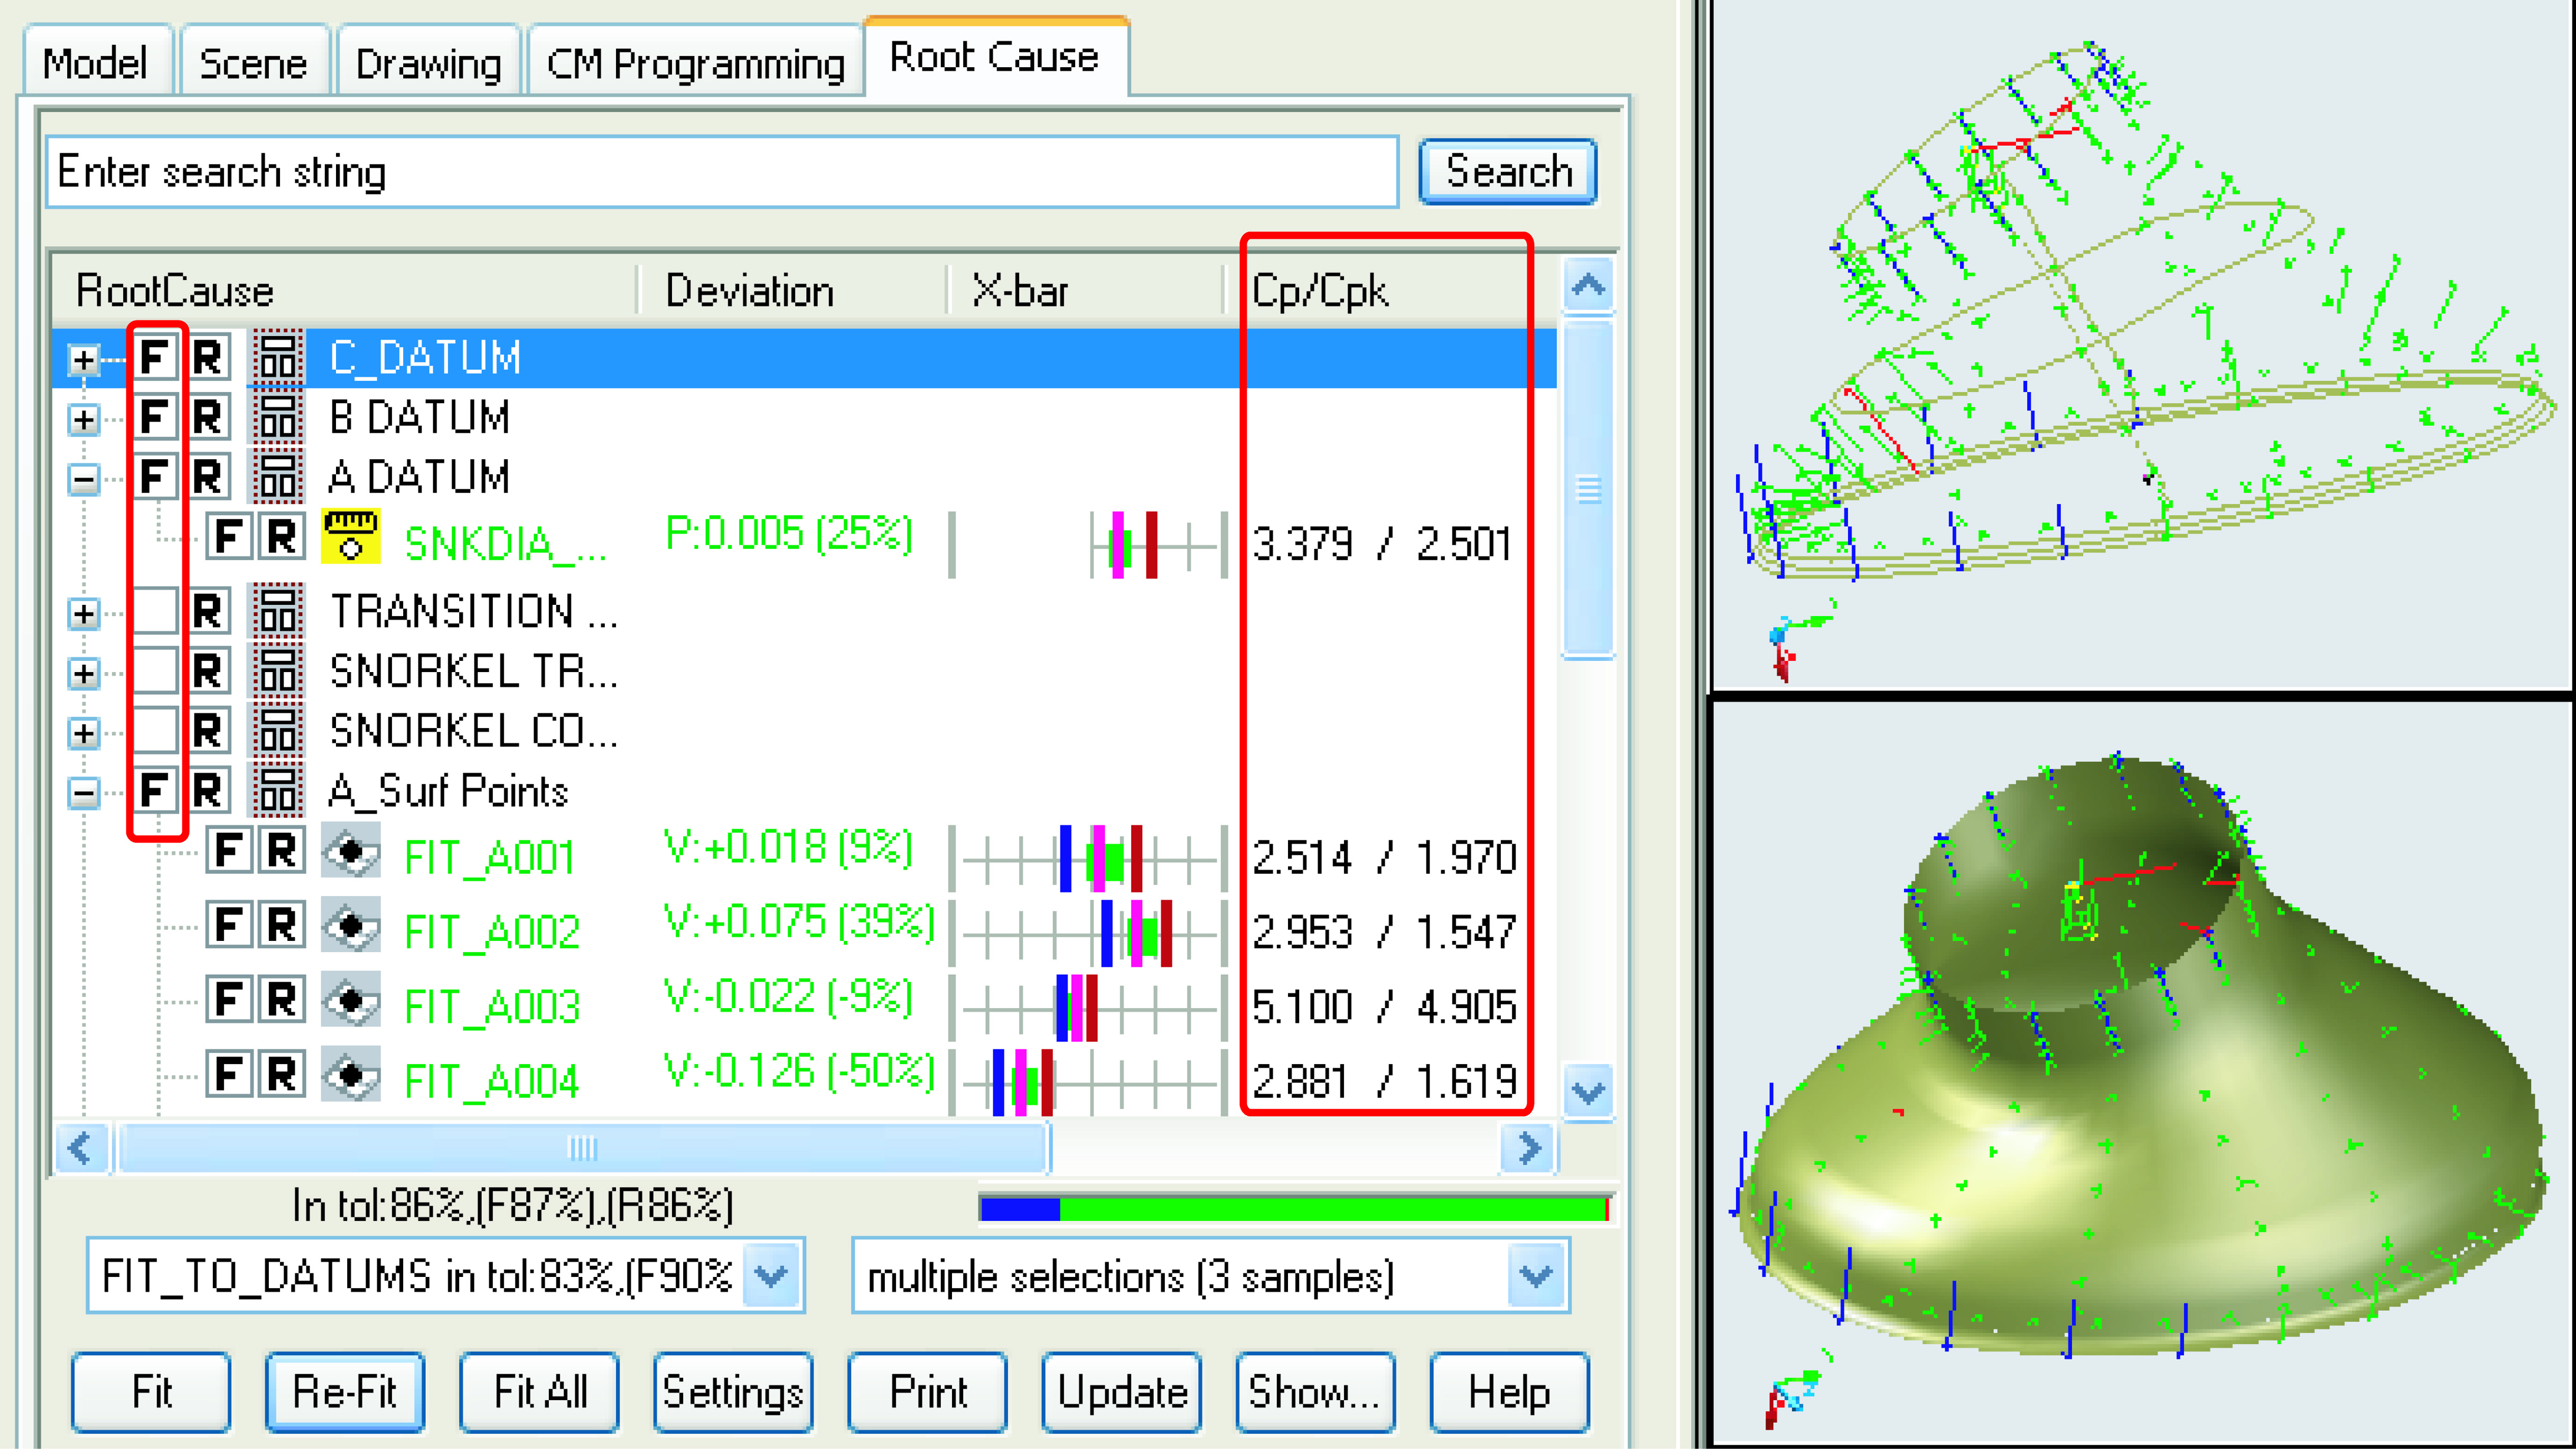
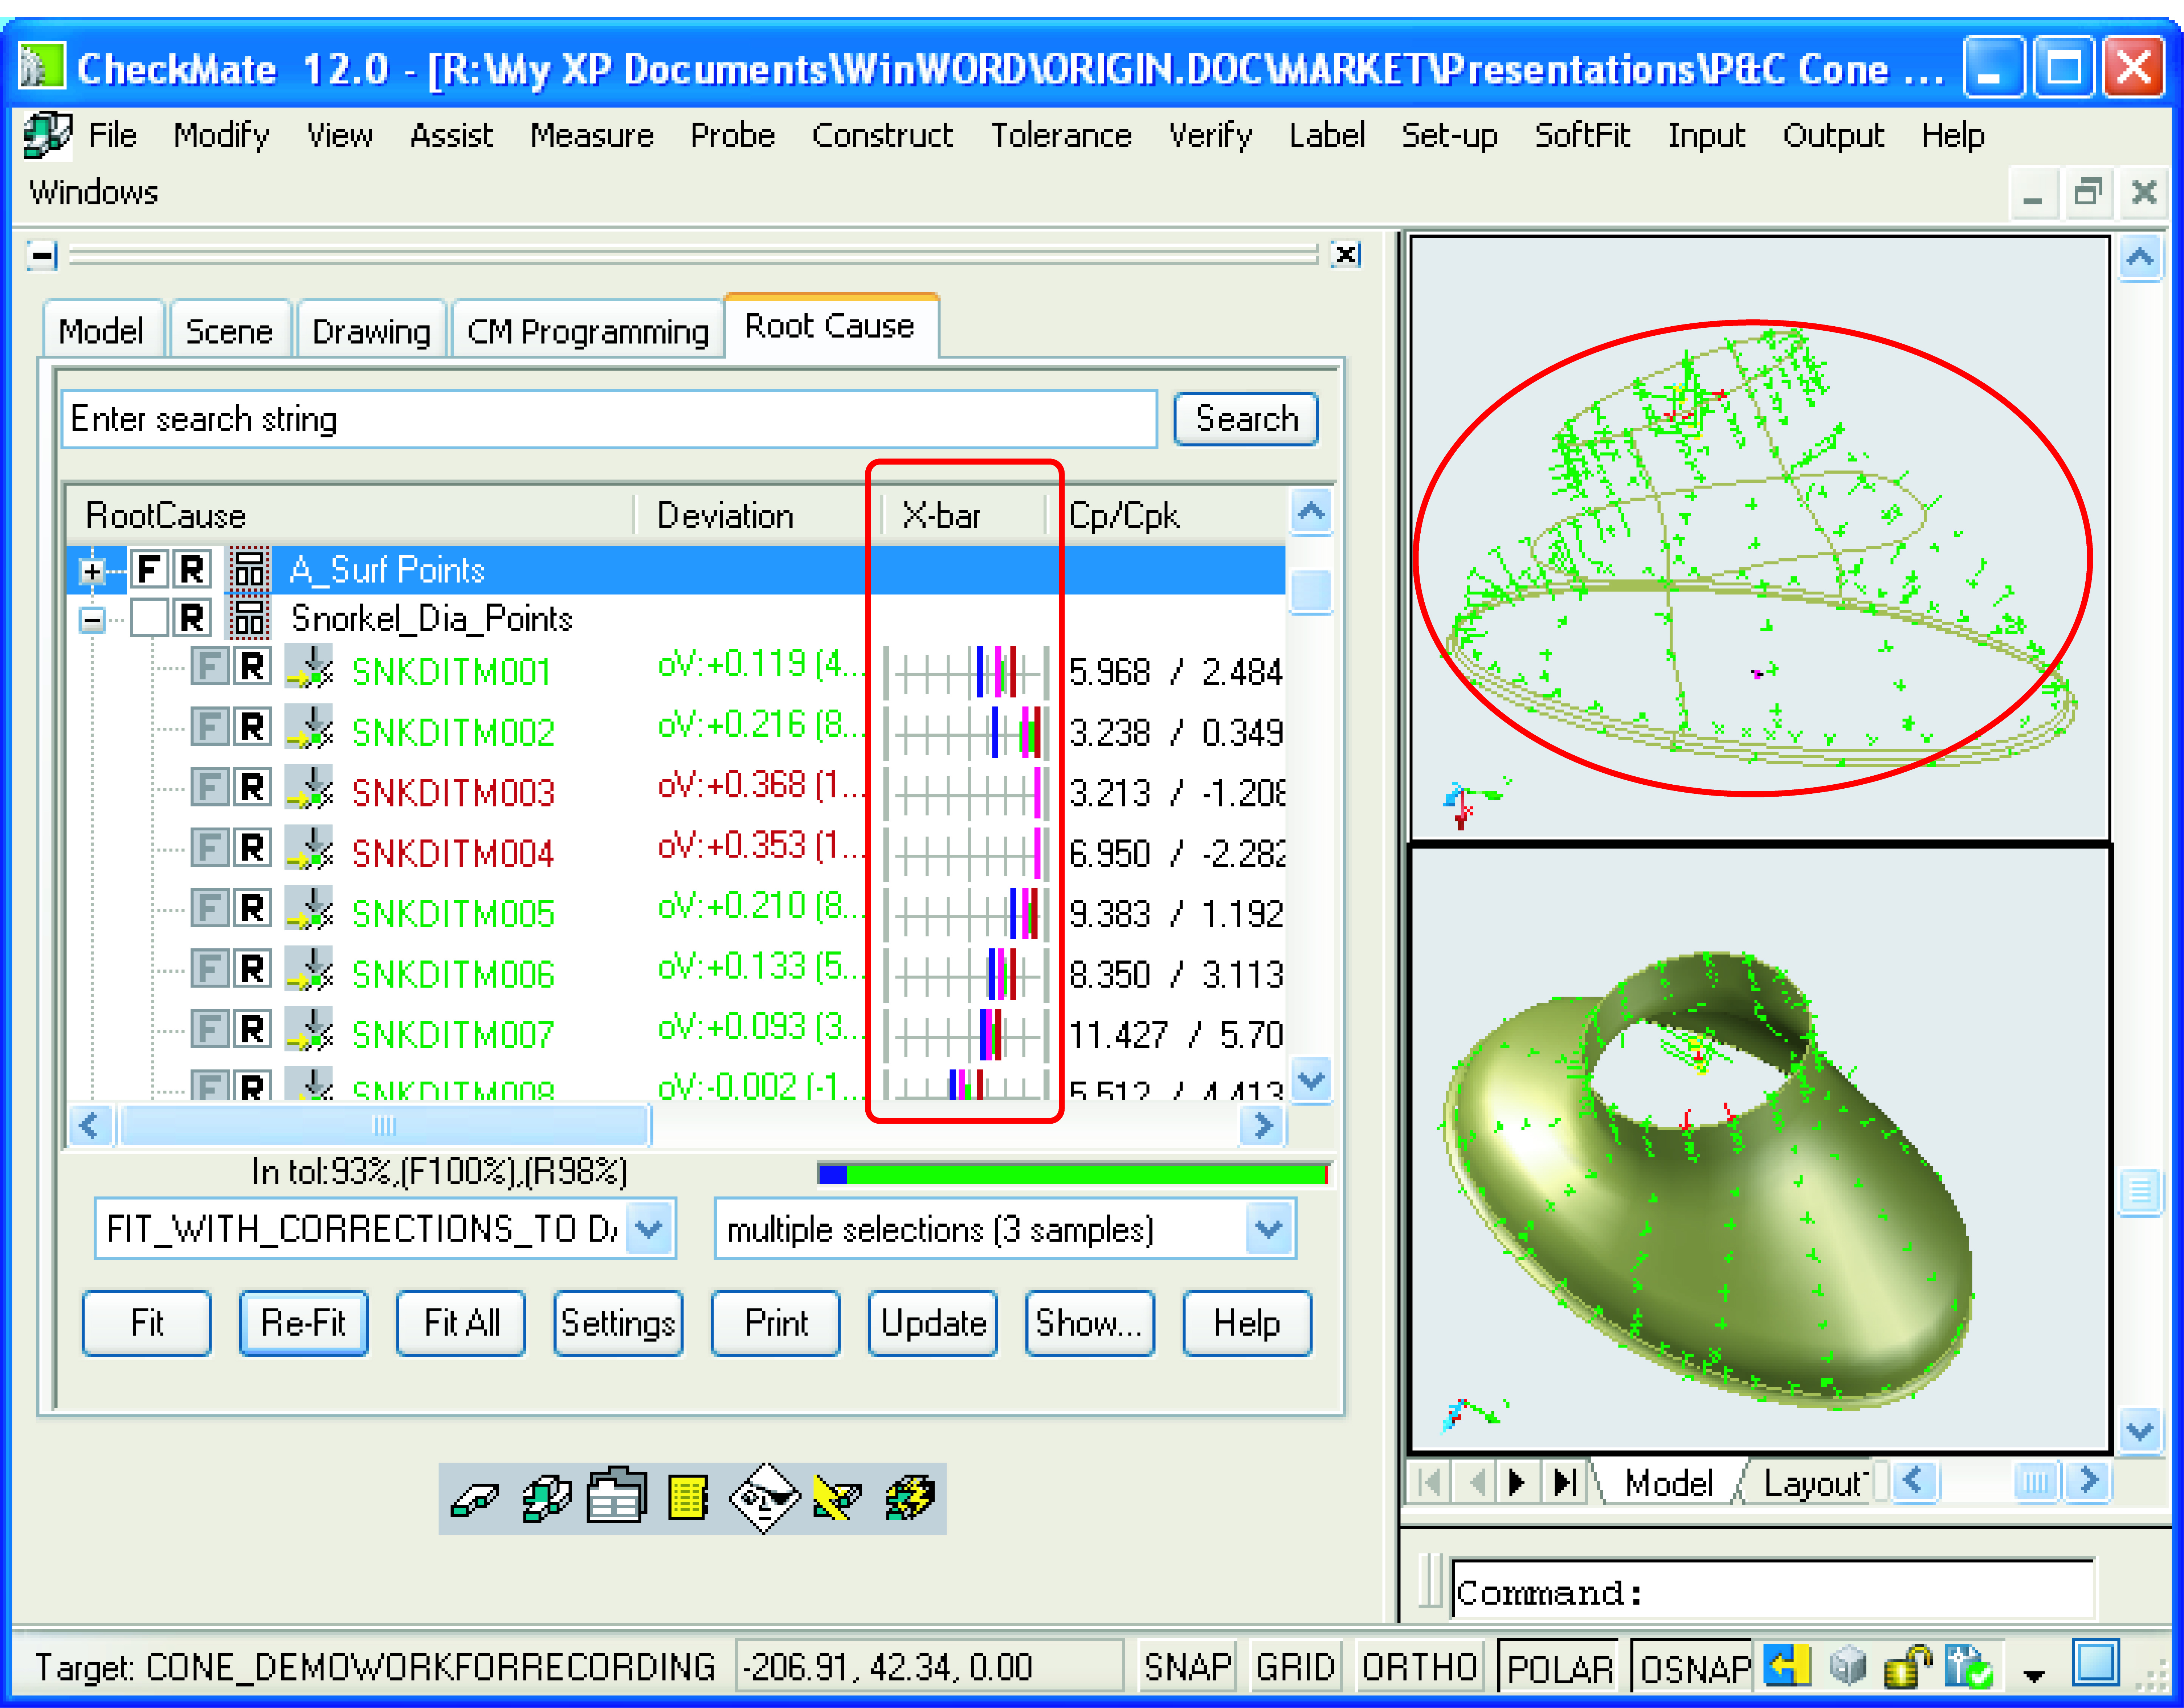
Figure 1 shows the CMM results of several sample parts in Origin’s Launch-Rite window. The deviations seen in the CMM results do not agree with what is being seen at the gage. The first step is to eliminate this confusion by simulating the gage as shown in Figure 2.
Using the fit algorithms we are able, within a few moments, to get the CMM results and the gage to agree. In other words, the oval plane is canted. All of the internal measurements of the cone transition area are undersized. There are also some problems with datum A, but what is indicated is that Transition area datum C hasn’t completely formed.
Next, we look for long red or blue whiskers that signal major deviations and discover there are, in fact, long red whiskers on the transition surface that draw immediate attention. This shape is formed by a stage of the die that is expensive to fix.
Applying fit shows that the transition surfaces are good. It would have been easy to conclude that the transition surface was the problem, correct it, and make the problem worse. Similarly, the hits on the end of Snorkel, i.e. its edge, are showing a deviation in blue. This late hit indicates it is too short.
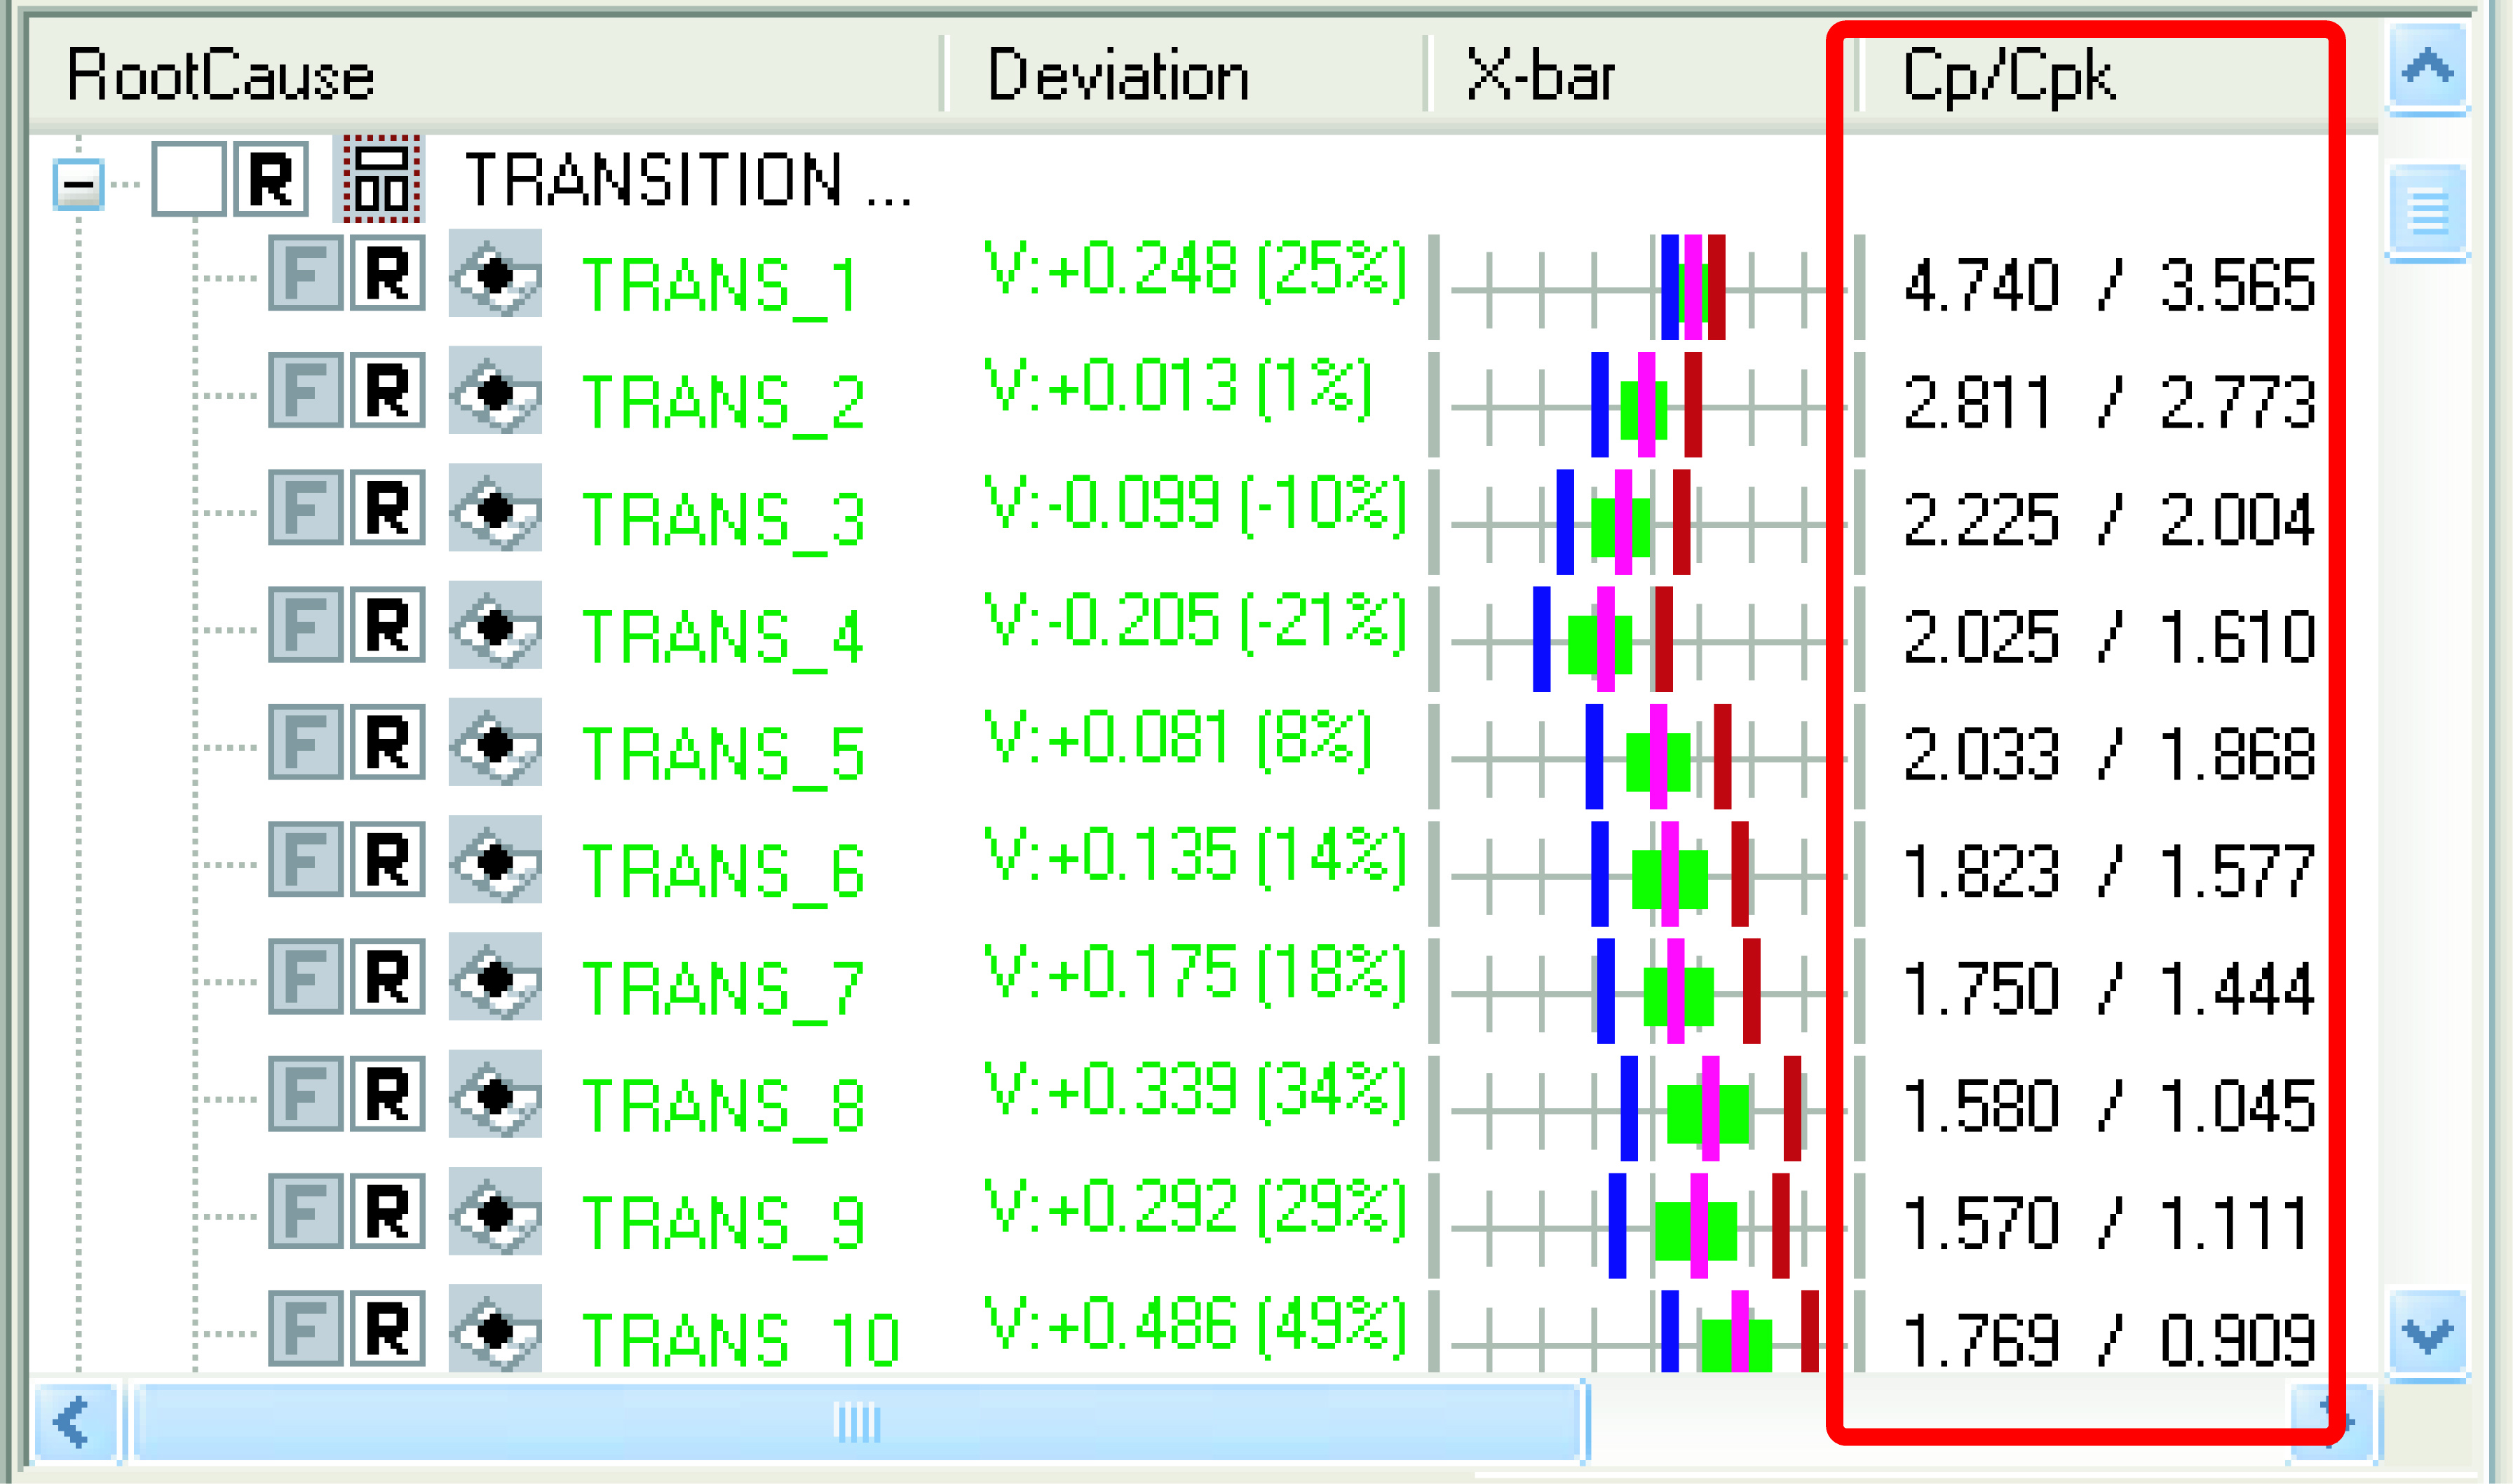
The final data validation step is to re-check for process capability. Any feature that we will fit and apply offsets to must be stable. Launch-Rite provides Cp/Cpk for each feature, and Figure 3 shows high Cp values – 1.33 and above – in the Transition area. So if we use these features in the fits and offsets, and others with similarly high Cp values, we can feel comfortable that using the average part will only require one change or iteration.
Isolating the Root Cause
To fix Datum C is difficult because it is the die plane, so the goal is to move the error elsewhere. The easiest fix is to raise the steel at that die station. This will cause the cone draw further over the steel and have the effect of extending Datum C lower and flattening it to the die plane.
It will also correct the transition features in the form portion of the part.
Determining the Fix
Data validation reveals a best-fix scenario that would not be evident otherwise. Because we know the process is capable and each simulation takes a few minutes, we are able to be more aggressive by making multiple changes simultaneously in each simulation.
In the course of three simulations the following changes are made:
- Datum C is fixed by shimming the die station 0.750 mm in along the minus X-axis.
- Datum B is forced to the die plane, which is a fixed parameter. Forcing Datum B onto the die plane forces corrections elsewhere.
- Using the new Datums B and C enables us to move the die stations that form the Snorkel feature 0.350 mm in the Y-axis so that we can fix Datum A and the Snorkel.
The results of all these simulations are shown in Figure 4.
Results
The combined total for data validation and corrective action took five hours. Using the manual method this maintenance cycle would have taken five days.
Simulation eliminates the need for additional part runs, measurements and analysis. Any remaining corrective actions are minor. Some welding and grinding were required on the die, along with the shimming of one die station. The software generates a Capability Report, PPAP and other data needed for buyoff.
Most importantly, the shop now have a robust tool that withstands several years of process variations, including steel, lubrication, press speed, etc., without further maintenance in its press operations.
While the focus here is on maintenance, this software is also being used to improve the part launch process. For complex stampings the time savings are substantial. Cash flow can also be improved by deferring gage construction.
Gages are rarely available when the first buyoff samples are run. Because you can now simulate a gage in the software analysis, you can build gages after the process is stabilized and corrective action on the die is implemented.

