The Cost, Common Culprits, Detection and Repair of Compressed Air System Leaks
An ongoing leak detection audit and repair program will quickly pay for itself through energy savings (and may even be subsidized by local utility incentive programs). Equally important, you will likely see benefits from reduced downtime and better running production equipment. All of these contribute to a stronger bottom line.
Posted: April 21, 2014
Imagine leaving your doors and windows open during the coldest winter days. Your furnace would run nonstop to try and heat your house. Your energy bill would skyrocket. Your home would still be chilly, you’d scramble to find other ways to keep warm, and your furnace would wear out more quickly. Now think of the equivalent scenario in a compressed air system. You should be thinking of the costs associated with compressed air leaks.
In this paper, we’ll discuss how many companies are losing thousands of dollars each year to compressed air system leaks. We will address where leaks commonly occur, leak detection methods, and practical advice for an audit and repair plan. We’ll explain why an ongoing leak detection and repair program can be one of the most cost-effective measures a shop can use to benefit its bottom line.
THE COST OF COMPRESSED AIR LEAKS
Compressed air systems are in nearly every industrial facility in the United States, and the undeniable fact about those systems is: they all have leaks. The U.S. Department of Energy, supported by countless system audits, estimates the average leakage rate is 25 percent. In fact, some plants lose as much as 80 percent of their compressed air to leaks. So, if compressed air systems account for an estimated $5 billion per year in energy costs, that equates to a large amount of energy needlessly wasted and millions (if not billions) of dollars spent on lost air.
In addition to added energy consumption, leaks also cost compressed air users by impacting productivity and equipment life. Let’s take a closer look at how leaks can translate to large amounts of energy and money being wasted on a daily basis:
1. Wasted electricity. Compressed air leaks are simply demands for air that create no value. Further, they consume flow needed by other productive uses. This often results in significantly decreased pressure at the points of use. To compensate, some users will then turn up the pressure at the compressor, which only makes things worse since a leak will waste more air at higher pressure.
We can calculate the annual energy cost for each individual leak with the following formula:
Annual cost of a leak = Leakage rate (cfm) x kW/cfm x operating hours x $/kWh
Now let’s look at some examples assuming a typical compressor efficiency of 18kW/100 cfm (.18kW/cfm), an electric rate of $0.05 per kWh, 100 psig and nearly continuous operation:
- 1/16 in leak @ 100 psig = 6.5 cfm x .18 kW/cfm x 8,000 hours x $0.05 per kWh => $468 per year
- 1/8 in leak @ 100 psig = 26 cfm x .18 kW/cfm x 8,000 hours x $0.05 per kWh => $1,872 per year
- 1/4 in leak @ 100 psig= 104 cfm x .18 kW/cfm x 8,000 hours x $0.05 per kWh => $7,488 per year
Notes:
- The cfm flow through a leak varies with the air pressure, and the size and shape of the orifice.
- Compressor efficiency for a particular compressor can be found in the CAGI data sheet for that model.
- The average electrical cost per kW in the U.S. is approximate $0.07/kW.
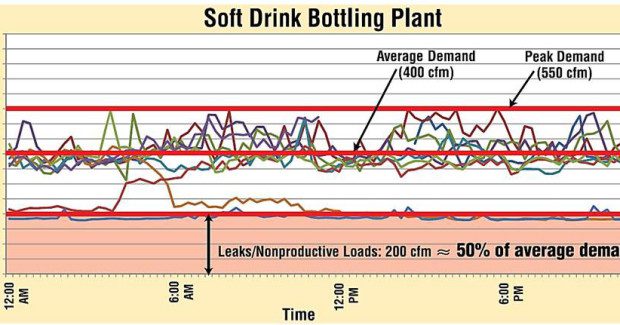
Again, the above examples are the cost per leak. It’s easy to see how the total annual cost of all system leaks quickly adds up. In a real world example (see Figure 1), a soft-drink bottling plant had leaks that made up approximately half of the average compressed air consumption. With a local industrial electricity rate of $0.13/kWh, the constant demand cost as much as $34,000 per year in electricity. It is not unusual for estimated annual savings to range from $1,500 in smaller systems to $175,000 in larger systems.
2. Reduced productivity. Excessive leaks can also cause system pressure to fluctuate, which can cause air-operated equipment to not perform as intended. High scrap rates and automatic equipment shutdown are common symptoms of this problem. A leaky system is also ill-prepared to take on additional capacity when surges in production and growth occur, since the system is alreadyworking harder than necessary to meet existing production demands.
3. Increased service costs. Maintaining pressure in a leaky compressed air system requires the compressor to run more. More run time means more frequent maintenance and possibly reduced equipment life. The more you have to repair a compressor, the more (often unscheduled) downtime that compressor will have, further reducing productivity. Ultimately, you may end up replacing the compressor sooner because it’s continually working harder than necessary, thus reducing the overall service life of the system.
COMMON CULPRITS: THE DIRTY 30 AND OTHERS
Frequent Problem Areas
Leaks are found from the compressor all the way to the points of use. The more fittings and hoses you have, the more leaks you are likely to have. They may occur in poorly installed fittings or in joints that have loosened or degraded over time. Leakage points are often located in what Tom Taranto, a well-known compressed air specialist, refers to as “the dirty 30” – the last but of piping to the point of use. This is generally the smallest piping and hose size, and gets the most vibration and stress from the point of use.
Problem areas include:
- Condensate traps
- Shut-off valves
- Fittings and pipe joints
- Filters, regulators and lubricators
- Disconnects
- Hoses
- End-use equipment
- Bag houses
- Cylinder rod packing
Worn packing, missed welds, missing O-rings and other issues can also be the source of costly leaks.


