Manage Welding Operations From Your Home Office
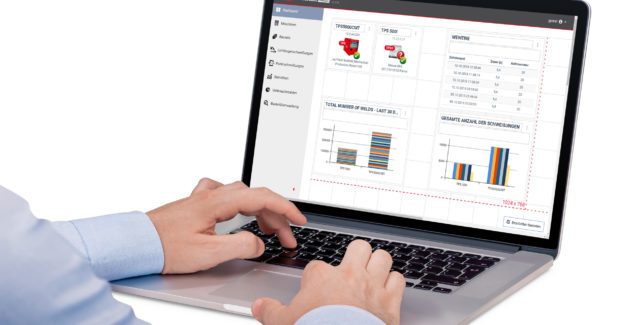
Multiple workers and Fronius equipment can be monitored singly and in the aggregate when networked with the company’s WeldCube Premium software. The program provides easily accessible data documentation and analysis via a central database.
Posted: September 28, 2020
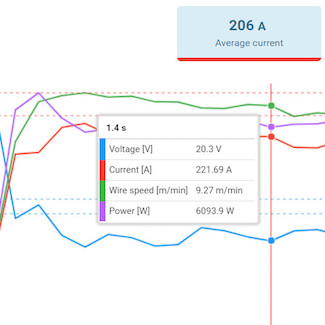
Transparency, safety, productivity and time savings are common requirements in welding production. Recording welding data for documentation and analysis can be of invaluable assistance, which is what WeldCube data-management software from Fronius USA (Portage, IN) does. With the program’s premium version, data from networked TPS/i MIG/MAG and cold metal transfer (CMT) equipment is stored in a central database that enables comprehensive and component-specific documentation, evaluation, and analysis.
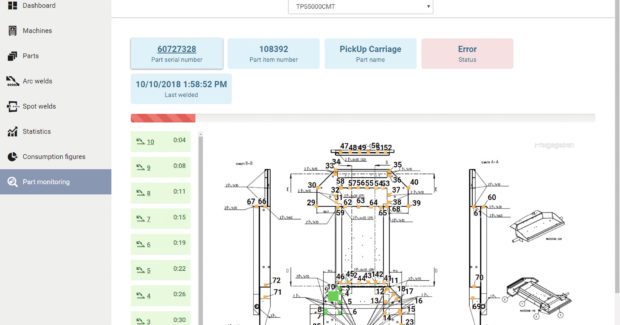
Using a VPN connection, the customer launches WeldCube Premium via an Internet browser to access an overview of all networked Fronius equipment. The software provides intelligent management and statistical functions and enables component-specific documentation and analysis of the welding operation on the individual and aggregate levels. For example, in a live display, it shows whether a weld seam has been welded or whether limit values have been violated.
This means production managers, line managers, welding coordinators, and maintenance managers can support colleagues who are on the production floor from their home or isolated office. If production personnel identify quality problems with a weld seam, they can forward the information to the responsible welding engineer. Not only does this engineer have an outline of the problem, the engineer can also analyze the error immediately based on the data from the WeldCube Premium documentation. Parameters of the welding task can be remotely corrected.
In addition, it’s possible to track the degree of utilization of the machines and their status, the component progress, or any problems that occur. Central storage of the data enables them to be documented in relation to each component and PDF reports or graphs can be generated per component.


